Monitoring is watching a known set of measurements and raising an alert when one crosses a limit: GPU temperature too high, memory nearly full, responses too slow. Observability is having enough recorded detail to work out why something went wrong, including problems nobody predicted: which request, which document, which model version, which step. An AI service needs both, and it needs one thing ordinary IT systems do not: a way to notice that the answers have become worse while every dashboard is still green.
What is the difference between monitoring and observability?
| Monitoring | Observability | |
|---|---|---|
| Question answered | Is something wrong? | Why is it wrong? |
| Data | Metrics and thresholds | Metrics, logs and traces linked per request |
| Handles | Failures you anticipated | Failures you did not |
| Typical output | Dashboard and alert | The full story of one request |
| AI example | Time to first token above 3 seconds | The slow requests all retrieved one 80-page scanned PDF |
What should you watch? Four layers
1. Hardware
GPU utilisation, GPU memory used, temperature, power draw, throttling events, memory errors, disk space and disk health. These tell you whether the machine has headroom and whether it is degrading. NVIDIA's DCGM exporter feeds these into Prometheus and Grafana; we set that up step by step in monitoring a DGX Station with DCGM, Prometheus and Grafana.
2. Service
Time to first token, tokens per second, requests in progress, queue length, error and timeout rates, and tail latency. Tail latency is the experience of the slowest requests: the p95 figure is the response time that 95 percent of requests beat. CALC. With 2,000 requests a day, 5 percent is 100 requests slower than p95, and 1 percent is 20 requests slower than p99. Those are the ones users complain about. The metrics are explained in AI model serving explained.
3. Quality
This is the layer unique to AI. A model can be fast, available and wrong. Signals to collect:
- User feedback: thumbs up or down, and corrections.
- A fixed evaluation set of questions with known good answers, re-run on a schedule and after every change.
- For RAG: whether the retrieved passages were relevant, and whether the answer stayed within them.
- Rate of refusals and of answers with no citation.
- Spot checks by a person on a sample each week.
See AI hallucinations explained for what these checks are looking for.
4. Usage and security
Who is using the service and how much, tokens per user and per department, which tools are being called, attempts to reach blocked content, and unusual patterns such as one account sending thousands of requests at night. This layer supports capacity planning, cost allocation and incident investigation. See prompt injection explained.
What is a trace, and why does AI need one?
One user question can trigger a chain: rewrite the question, search the index, retrieve five passages, call the model, call a tool, call the model again. A trace records every step of that chain for a single request, with timings, inputs and outputs. When an answer is wrong or slow, the trace shows which step was responsible. Without it, a multi-step assistant is very hard to debug. Open standards such as OpenTelemetry are widely used to collect traces, and several open-source tools specialise in LLM tracing.
A traditional server fails loudly. An AI service can fail politely, with a well-written wrong answer. Monitoring has to be built to hear that.
What is drift?
Drift is a gradual change in quality without a change you made deliberately. Causes include documents in the knowledge base being updated or going stale, users asking new kinds of questions, an upstream model or library version changing, and a prompt edit with side effects. A scheduled evaluation run against a fixed question set is the simplest drift detector: if last month's score was 46 out of 50 and this month's is 39, something changed.
A starter set of alerts for a small deployment
| Alert | Why |
|---|---|
| GPU memory above 90 percent for 10 minutes | Next long request may fail |
| GPU temperature near the throttle point | Cooling or airflow problem |
| Disk above 85 percent | Logs and models fill drives quickly |
| Service not responding to a health check | Basic availability |
| p95 time to first token above your target | Users are waiting |
| Error or timeout rate above 2 percent | Overload or a failing component |
| Evaluation score drops by more than a set margin | Quality drift |
| Any request to a blocked outside address | Possible exfiltration attempt |
The thresholds are starting points to tune, not standards.
What about privacy?
Prompt and response logs contain whatever staff typed, which can include personal and confidential data. Decide who may read the logs, how long they are kept and whether sensitive fields are masked, and write it down. Keeping the logs on your own storage, with access control and a retention period, is one of the practical advantages of a local deployment. See data residency vs data sovereignty.
Buying in Singapore
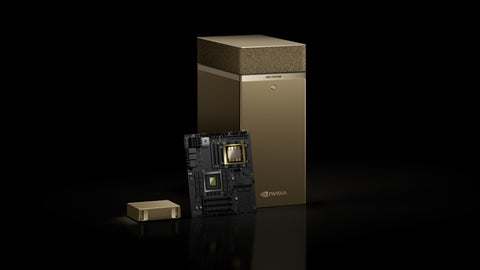
Logs, traces and evaluation results need somewhere durable to live. For that and for backups of the AI server, the Synology DS925+ (S$1,260) or Synology DS1825+ (S$2,148). To run the monitoring stack on a separate small machine so it survives an AI server outage, the GMKtec NucBox K13 (S$1,214.22). For the AI system itself, the NVIDIA DGX Spark 4TB (S$9,450) (listed 11 Nov 2026; prices change; ask for a current quotation). To start, use Request for Quotation on the product page, call (65) 6978 3502, email Sales@sourceit.com.sg or use our contact page.
Frequently asked questions
What is AI model monitoring? It is the ongoing measurement of an AI service in production, covering hardware health, speed, errors, answer quality and usage, with alerts when a measurement crosses a set limit.
What is the difference between AI monitoring and AI observability? Monitoring tells you that something is wrong using predefined metrics. Observability gives you linked metrics, logs and traces detailed enough to find out why, including for problems you did not anticipate.
What is model drift? Drift is a gradual decline or change in an AI system's output quality caused by changes in data, user behaviour, software versions or prompts, often without any visible error.
How do you monitor answer quality? Combine user feedback, a fixed evaluation set re-run regularly, retrieval relevance checks for RAG systems and periodic human review of sampled answers.

SourceIT Approved
Researched and verified by the SourceIT team for Singapore buyers.